When we think of Europe, our minds conjure images of ancient cities, densely populated countries, and landscapes transformed by millennia of human activity. It often seems that there is no room left for true, untouched wilderness. But is that really the case? Where do the frontiers of the wild world lie on our continent, and can we even measure something as elusive as "wildness"?
Recently, in collaboration with my colleague Stephen Carver from the Wildland Research Institute at the University of Leeds, we set out to answer this question. The result is a scientific paper and a new map of unprecedented scope—the Wilderness Quality Index for Europe 2.0 (WQI 2.0). This work does not simply update previous data; it expands our knowledge to the entirety of continental Europe, including previously unmapped territories in Eastern Europe, and harnesses planetary-scale computational power to do so.
Why is a Map Like This Needed?
The idea of mapping wilderness is not just an academic exercise. It is an urgent necessity, dictated by our times. In 2009, the European Parliament passed a resolution calling for the protection and restoration of wild areas. But to protect something, you must first know what and where it is. We need a reliable, objective basis for decision-making: where are the priorities for establishing new protected areas? Which territories are under threat? How can we track the success of nature restoration (rewilding) programs?
Our map is precisely such a tool. It helps to translate global initiatives into action, such as the "30x30" agreement, which aims to protect 30% of the world's land and seas by 2030.
The Recipe for "Wildness": How We Measured the Immeasurable
"Wildness" is a relative concept. What is wild to a resident of the Netherlands might seem like a cultivated landscape to an inhabitant of the Carpathians. Therefore, we developed a comprehensive index based on three key "ingredients":
-
Naturalness of the Landscape. How close is the territory to its original state? We analyzed satellite data, assigning the highest scores to primary forests, untouched wetlands, and rocky terrains. Lower scores were given to monoculture tree plantations and pastures, with their scores further reduced based on the intensity of livestock grazing. The lowest scores, of course, went to cities and croplands.
-
Remoteness from Infrastructure. Wilderness begins where the roads end. We calculated how difficult it is to reach every point on the continent on foot. In doing so, we used not simple distance but more complex "cost-distance" models, which account for the fact that walking through a dense forest or climbing a steep slope is far more difficult than moving across a plain.
-
Remoteness from People. Beyond roads, we considered other signs of human impact: the location of settlements, population density, and even the glow of night lights visible from space. The further from these centers of civilization, the higher the quality of the wilderness.
To process the gigantic arrays of data for the entire continent at a high resolution (10 meters per pixel), we utilized the Google Earth Engine (GEE) cloud platform. This is a true supercomputer for geospatial analysis, allowing us to perform calculations that would have been impossible just a decade ago.
What Did the New Map Reveal?
The results of our work, which anyone can explore on the interactive web map, both confirm intuitive assumptions and reveal non-obvious facts.
-
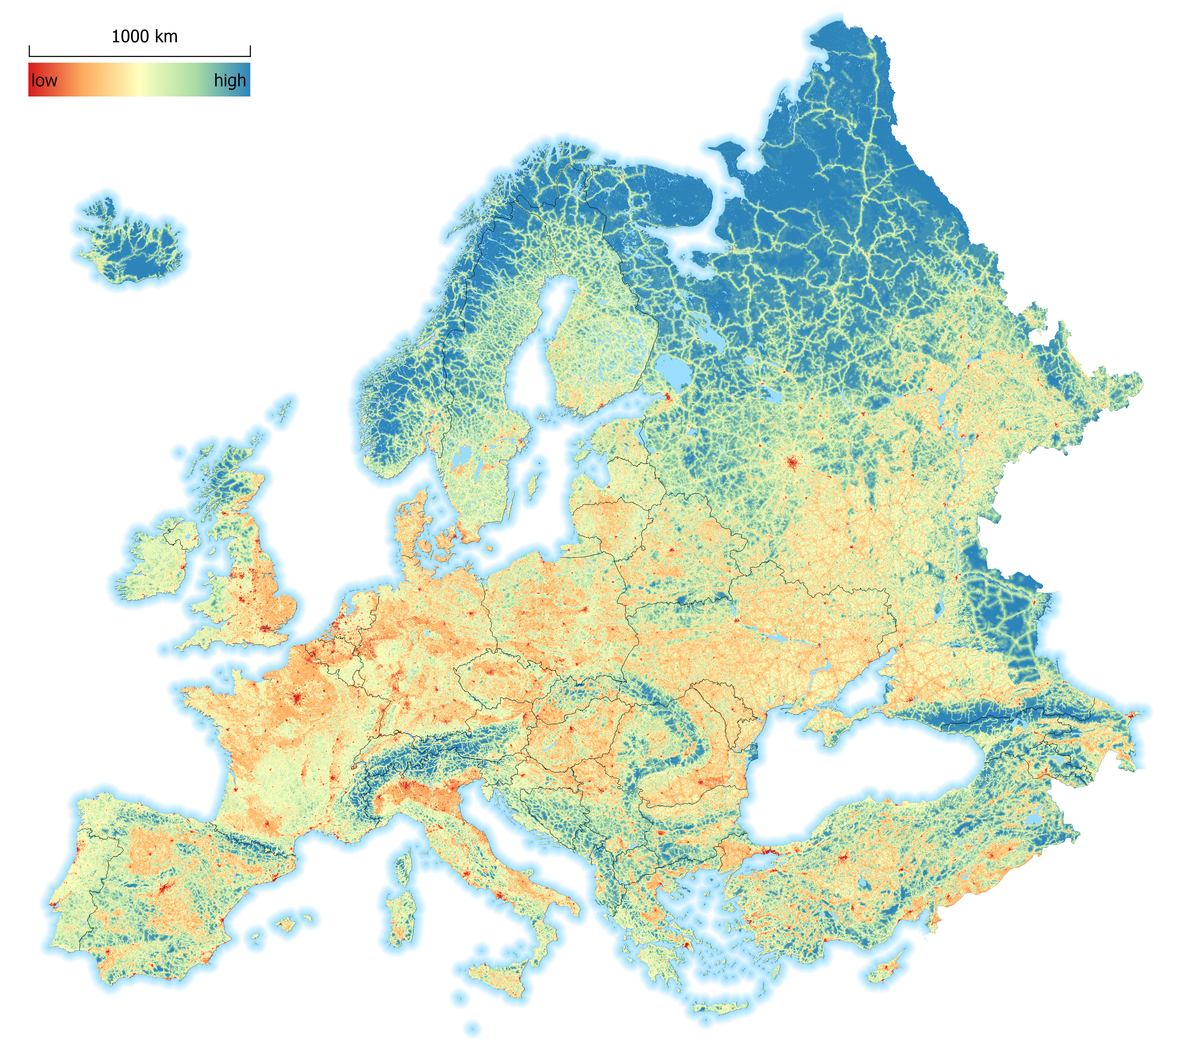
The Strongholds of Wildness. As expected, the highest wilderness quality is found in mountainous regions (the Alps, Carpathians, Caucasus, Pyrenees) and the remote northern territories of Scandinavia and European Russia. Iceland, Norway, and Georgia top the list of countries by the percentage of their land that is wild.
-
The Most Critical Discovery. Perhaps the key finding of our work is that significant areas of high-quality wilderness lie outside existing national parks and protected areas. This is "unprotected wilderness"—extremely vulnerable territories under constant threat of degradation from logging, mining, or infrastructure development. Our map clearly identifies these hotspots that require immediate attention.
-
Expanding the Horizon. Including Eastern European countries in the analysis, which were absent from previous studies, allowed us to see a more complete and coherent picture. This is critically important for developing joint, transboundary conservation strategies.
Conclusion: From Knowledge to Action
The WQI 2.0 map is not just a static image. It is a living, dynamic tool for scientists, government officials, and conservation organizations. It allows us to:
- Set Priorities: Identify the most valuable areas for protection.
- Plan Restoration: Find territories where rewilding programs will have the greatest effect.
- Monitor Change: By updating the map in the future, we can track how the state of Europe's wilderness changes under the influence of climate change and human activity.
The creation of this map was made possible by a combination of cutting-edge technology, open data, and international scientific collaboration. It gives us a unique opportunity to look at our continent anew and, more importantly, provides the knowledge necessary to act. After all, we can only protect Europe's last wilderness if we know exactly where to find it.
Links: * Explore the interactive WQI 2.0 map * Read the original scientific paper in the journal "Land"